Debugging on ESP32
Serial debugging
If an exception occurs in debug builds then a prompt will be printed to the serial terminal
such as Entering gdb stub.
As with the ESP8266, if such an exception occurs you can stop the serial debug terminal and type make gdb.
More advanced debugging is available via JTAG if you have the appropriate tools.
See https://docs.espressif.com/projects/esp-idf/en/release-v4.3/esp32/api-guides/fatal-errors.html for further details.
Required tools and hardware
A debugger and a JTAG hardware are required. The debugger is part of the provided toolchain. Make sure that you have the following executable in your PATH:
xtensa-esp32-elf-gdb
Debugging with JTAG is explained in details in the ESP-IDF documentation. Make sure to read it carefully.
For the purposes of this documentation we will be using ESP-Prog JTAG adapter and ESP32-Cam microcontroller from AI-Thinker.
Configure Hardware
The JTAG adapter has to be connected to your ESP32 microcontroller. The following pins from the JTAG adapter have to be connected to ESP32 for the communication to work.
ESP32 Pin
nodeMCU Pin
USB Blaster
JTAG Signal
1
VCC
3V3
4
VCC
2
MTDO / GPIO15
D15
3
TDO
3
MTDI / GPIO12
D12
9
TDI
4
MTCK / GPIO13
D13
1
TCK
5
MTMS / GPIO14
D14
5
TMS
6
GND
GND
2
GND
Running OpenOCD
Once the JTAG adapter is connected to the microcontroller and to a computer we have to start the OpenOCD server that will communicate with the JTAG adapter. For our specific hardware the following command has to be executed:
openocd -f interface/ftdi/esp32_devkitj_v1.cfg -f target/esp32.cfg
If you have configured your JTAG adapter correctly the following messages should show up:
Open On-Chip Debugger  v0.10.0-esp32-20190313 (2019-03-13-09:52)
Licensed under GNU GPL v2
For bug reports, read
    http://openocd.org/doc/doxygen/bugs.html
none separate
adapter speed: 20000 kHz
Info : Configured 2 cores
esp32 interrupt mask on
Info : Listening on port 6666 for tcl connections
Info : Listening on port 4444 for telnet connections
Info : ftdi: if you experience problems at higher adapter clocks, try the command "ftdi_tdo_sample_edge falling"
Info : clock speed 20000 kHz
Info : JTAG tap: esp32.cpu0 tap/device found: 0x120034e5 (mfg: 0x272 (Tensilica), part: 0x2003, ver: 0x1)
Info : JTAG tap: esp32.cpu1 tap/device found: 0x120034e5 (mfg: 0x272 (Tensilica), part: 0x2003, ver: 0x1)
Info : esp32: Debug controller 0 was reset (pwrstat=0x5F, after clear 0x0F).
Info : esp32: Core 0 was reset (pwrstat=0x5F, after clear 0x0F).
Info : esp32: Debug controller 1 was reset (pwrstat=0x5F, after clear 0x0F).
Info : esp32: Core 1 was reset (pwrstat=0x5F, after clear 0x0F).
Info : Detected debug stubs @ 3ffb42ac on core0 of target 'esp32'
Info : Listening on port 3333 for gdb connections
Info : accepting 'gdb' connection on tcp/3333
Recompilation is required
In order to debug applications based on Sming Framework make sure that you are using Sming version 3.8.0 or newer.
Compilation directives
If you want to debug your application and the Sming Framework code make sure to
(re)compile it with ENABLE_GDB =1 directive:
cd $SMING_HOME/../samples/Basic_Blink
make clean components-clean
make ENABLE_GDB=1
The commands above will re-compile Sming with debug symbols and optimizations for debugging.
Application
To use, (re)compile your application with the ENABLE_GDB option and flash it to the board. For this example we will use the Basic Blink sample application:
cd $SMING_HOME/../samples/Basic_Blink
make clean
make ENABLE_GDB=1 # -- recompiles your application with debugging support
make flashapp # flashes ONLY the (re)compiled application
The device will restart then wait for a debugger to be connected. Before starting the debugger you must be sure that the OpenOCD server is running and listening for incoming connections on localhost port 3333.
Now start the debugger:
make gdb
This will start a new debugging session. The debugger will try to connect to OpenOCD server and in the OpenOCD logs you should see a message similar to the one below:
Info : accepting 'gdb' connection on tcp/3333
Info : Target halted. PRO_CPU: PC=0x4012F7EE (active)    APP_CPU: PC=0x4012F7EE
Info : Target halted. PRO_CPU: PC=0x4009171A (active)    APP_CPU: PC=0x4012F7EE
Info : Flash mapping 0: 0x10020 -> 0x3f400020, 89 KB
Info : Flash mapping 1: 0x30018 -> 0x400d0018, 388 KB
Info : Target halted. PRO_CPU: PC=0x4009171A (active)    APP_CPU: PC=0x4012F7EE
Info : Auto-detected flash size 4096 KB
Info : Using flash size 4096 KB
And in the GDB console you will see a message similar to this one:
Reading symbols from out/Esp32/debug/build/app.out...done.
0x4012f7ee in is_wifi_clk_peripheral (periph=PERIPH_LEDC_MODULE)
    at /x/esp-idf/components/driver/periph_ctrl.c:225
225     switch(periph) {
JTAG tap: esp32.cpu0 tap/device found: 0x120034e5 (mfg: 0x272 (Tensilica), part: 0x2003, ver: 0x1)
JTAG tap: esp32.cpu1 tap/device found: 0x120034e5 (mfg: 0x272 (Tensilica), part: 0x2003, ver: 0x1)
esp32: Debug controller 0 was reset (pwrstat=0x5F, after clear 0x0F).
esp32: Core 0 was reset (pwrstat=0x5F, after clear 0x0F).
esp32: Debug controller 1 was reset (pwrstat=0x5F, after clear 0x5F).
esp32: Core 1 was reset (pwrstat=0x5F, after clear 0x5F).
Target halted. PRO_CPU: PC=0x5000004B (active)    APP_CPU: PC=0x00000000
esp32: Core 0 was reset (pwrstat=0x1F, after clear 0x0F).
Target halted. PRO_CPU: PC=0x40000400 (active)    APP_CPU: PC=0x40000400
Hardware assisted breakpoint 1 at 0x400e1cd3: file /x/Sming/Sming/Arch/Esp32/Components/esp32/startup.cpp, line 21.
(gdb)
If the debugger is exited, the application will continue execution as normal. Re-connecting the debugger will pause execution.
GDB commands
There are multiple commands supported in GDB and we will mention only some of them.
List current source code
One possibility is to see the source code of the current line where the
execution has stopped. To achieve this you should type list in the gdb
console:
(gdb) list
220
221 static bool is_wifi_clk_peripheral(periph_module_t periph)
222 {
223     /* A small subset of peripherals use WIFI_CLK_EN_REG and
224        CORE_RST_EN_REG for their clock & reset registers */
225     switch(periph) {
226     case PERIPH_SDMMC_MODULE:
227     case PERIPH_SDIO_SLAVE_MODULE:
228     case PERIPH_EMAC_MODULE:
229     case PERIPH_RNG_MODULE:
(gdb)
Break the execution
This command will pause the debugger once it reaches a specific function
or line in the code. This is called breakpoint and can be set like this:
(gdb) break blink
Breakpoint 2 at 0x400e1dc4: file app/application.cpp, line 9.
Continue the execution
To continue the execution of the application we can use the continue
command:
(gdb) continue
Continuing.
Target halted. PRO_CPU: PC=0x400E1DC4 (active)    APP_CPU: PC=0x4012F7EE
[New Thread 1073483724]
[New Thread 1073514968]
[New Thread 1073494600]
[New Thread 1073487892]
[Switching to Thread 1073412944]

Breakpoint 1, blink () at app/application.cpp:9
9 {
(gdb)
Because we have set already a breakpoint for the blink function the
execution will be paused when the blink function is reached and from
here you can go to the next line or see the current values of the
variables.
Go to the next line
This can be done using next:
(gdb) next
10      digitalWrite(LED_PIN, state);
See variable value
The command to see a value is print followed by the name of the
value. For example to see the value of the ledState variable inside
the blink function we could type:
(gdb) print state
$1 = true
You can see more useful commands here.
Or watch the following short video
Debugging with visual debuggers like Eclipse CDT
A good visualization helps us understand things faster. What we can do is use Eclipse CDT and its debugging plugins to do remote debugging as we did from the command line.
Here is how this can be done:
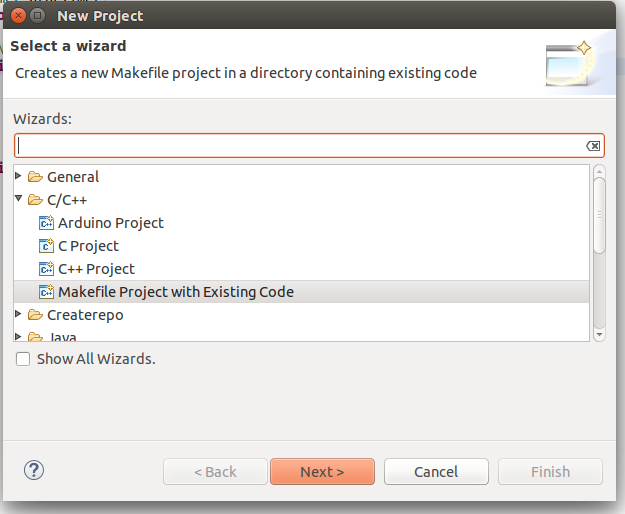
Start Eclipse CDT and import the Basic Blink sample:
Select File -> New -> Project -> C/C++ -> Makefile Project with Existing Code
Point Eclipse to the location of the Basic_Blink sample
Import the Sming Framework (if you haven’t done it yet)
Import Project
Once the two projects are in Eclipse, set the Basic_Blink project to reference the Sming project.
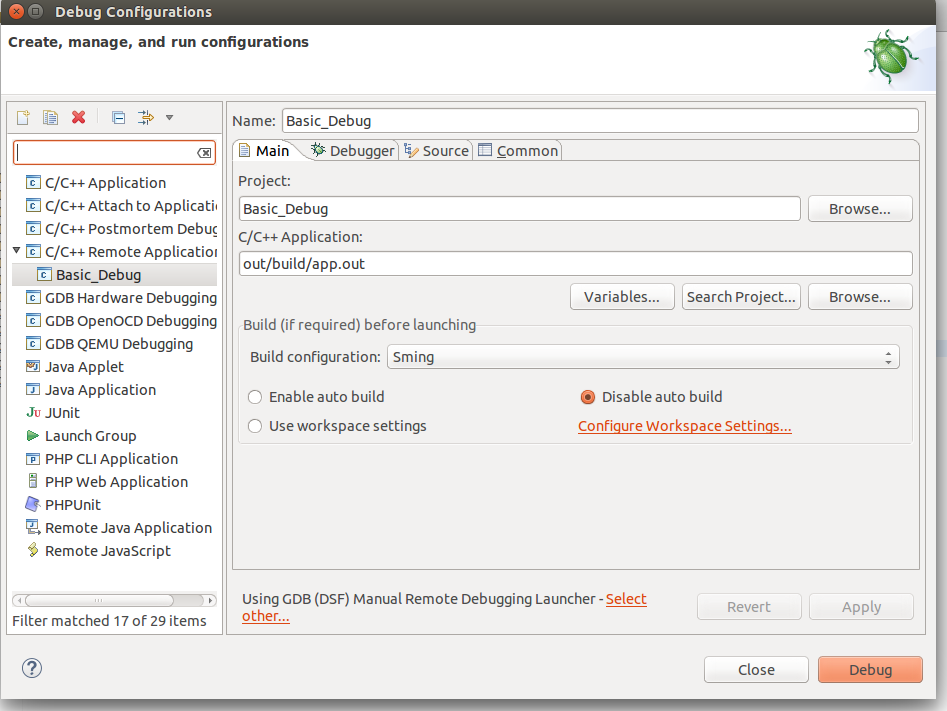
Now create a new Remote Debugging Configuration:
Select Run -> Debug Configurations -> C/C++ Remote Application
Right-click and create a new C/C++ Remote Application
In the Main tab set, set:
Project: Basic_Build
C/C++ Application: out/build/Esp8266/Debug/app.out
disable for now the auto build
Remote Debugging Session
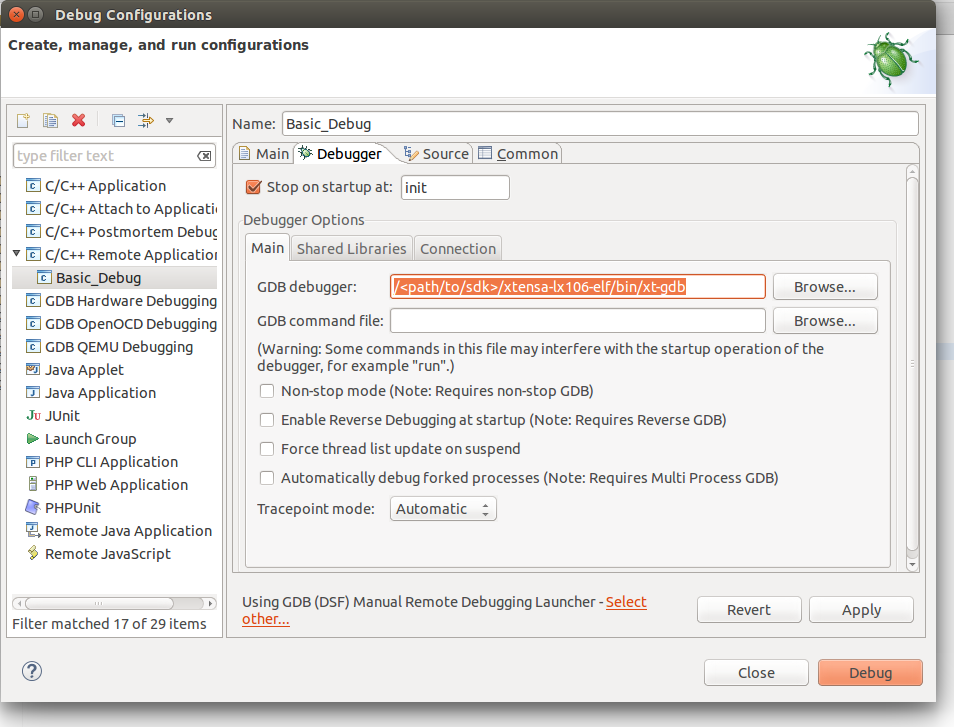
Then go to the Debugger tab and point the GDB debugger to your
Xtensa-gdb binary. (Type make list-config and look for GDB.)
Remote Debugging Session
Make sure to load also GDB command file. The file is called gdbinit, and you may wish to place
a copy of the file somewhere else, especially if you intend to modify it.
You can see the file here Sming/Arch/Esp32/Tools/gdbinit.
Finally we should configure the remote connection. Go to the Debugger -> Connection tab and set:
type: TCP
host: localhost
port: 3333
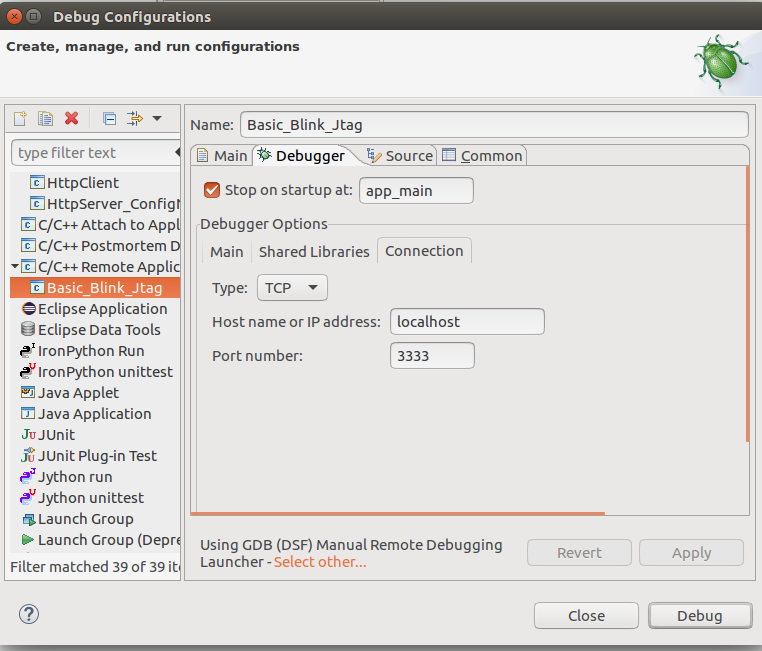
Set remote connection
We are now ready for debugging. Press the Debug button. (In the screenshot above the Debug button is in the bottom-right corner.) After some seconds your debugging session should be up and running and you can enjoy live debugging.
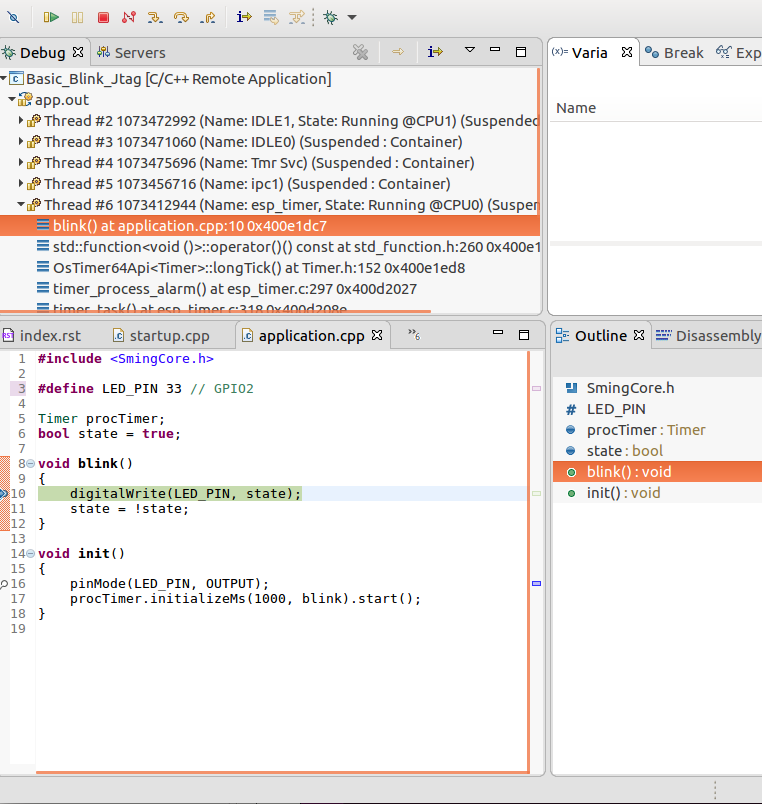
Live Debugging Session
You will be able to see the current variables and their values. You should be able to go step by step, go inside of functions, add breakpoints to code in RAM or add breakpoints to code that was in FLASH.