Debugging on Host
Required tools and hardware
A GNU C/C++ debugger is the only requirement for the Host architecture. Make sure that you have the following executable in your PATH:
gdb
No additional hardware is required.
Recompilation is required
In order to debug applications based on Sming Framework make sure that you are using Sming version 3.8.0 or newer.
Compilation directives
If you want to debug your application and the Sming Framework code make sure to
(re)compile it with ENABLE_GDB =1 directive:
cd $SMING_HOME/../samples/LiveDebug
make dist-clean
make ENABLE_GDB=1
The commands above will re-compile Sming with debug symbols and optimizations for debugging. These commands need to be executed once.
You can recompile Sming with the following directives to debug better Sming and the LWIP TCP/IP stack
cd $SMING_HOME/../samples/LiveDebug
make Sming-build all ENABLE_GDB=1 ENABLE_LWIPDEBUG=1
Application
To use, (re)compile your application with the ENABLE_GDB option and flash it to the board. For this example we will use the Live Debug sample application:
cd $SMING_HOME/../samples/LiveDebug
make clean
make ENABLE_GDB=1 # -- recompiles your application with debugging support
The next step is to start the debugger. This can be done with the command below:
make gdb
After that a new interactive debugging session will be started:
Welcome to SMING!
Type 'r' to run application
To start the execution of the application type r or run:
(gdb) r
Starting program: /x/Sming/samples/LiveDebug/out/Host/debug/firmware/app --flashfile=out/Host/debug/firmware/flash.bin --flashsize=4M --pause
[Thread debugging using libthread_db enabled]
Using host libthread_db library "/lib/i386-linux-gnu/libthread_db.so.1".
[New Thread 0xf7bdcb40 (LWP 16428)]

Welcome to the Sming Host emulator

host_flashmem_init: Created blank "out/Host/debug/firmware/flash.bin", 4194304 bytes

...
main: >> Starting Sming <<
You can pause the program execution by pressing Ctrl-C. And work further using some further GDB commands. The next paragraph describes some of them.
GDB commands
There are multiple commands supported in GDB and we will mention only some of them.
List current source code
One possibility is to see the source code of the current line where the
execution has stopped. To achieve this you should type list in the gdb
console:
(gdb) list
102     }
103 }
104
105 int main(int argc, char* argv[])
106 {
107     trap_exceptions();
108
109     host_printf("\nWelcome to the Sming Host emulator\n\n");
110
111     static struct {
Break the execution
This command will pause the debugger once it reaches a specific function
or line in the code. This is called breakpoint and can be set like this:
(gdb) break blink
Breakpoint 1 at 0x40105d4c: file app/application.cpp, line 66.
Continue the execution
To continue the execution of the application we can use the continue
command:
(gdb) continue
Continuing.

Breakpoint 1, blink () at app/application.cpp:66
66 {
(gdb)
Because we have set already a breakpoint for the blink function the
execution will be paused when the blink function is reached and from
here you can go to the next line or see the current values of the
variables.
Go to the next line
This can be done using next:
(gdb) next
67      digitalWrite(LED_PIN, ledState);
See variable value
The command to see a value is print followed by the name of the
value. For example to see the value of the ledState variable inside
the blink function we could type:
(gdb) print ledState
$1 = true
You can see more useful commands here.
Or watch the following short video
Debugging with visual debuggers like Eclipse CDT
A good visualization helps us understand things faster. What we can do is use Eclipse CDT and its debugging plugins to do remote debugging as we did from the command line.
Here is how this can be done:
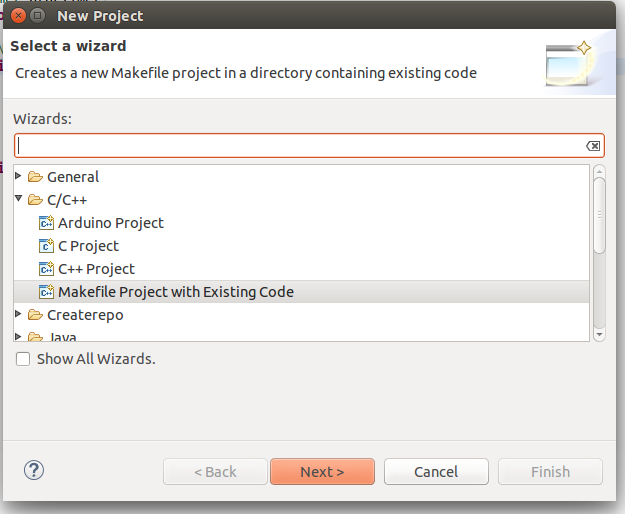
Start Eclipse CDT and import the Live Debug sample:
Select File -> New -> Project -> C/C++ -> Makefile Project with Existing Code
Point Eclipse to the location of the LiveDebug sample
Import the Sming Framework (if you haven’t done it yet)
Import Project
Once the two projects are in Eclipse, set the LiveDebug project to reference the Sming project.
Now create a new Debugging Configuration:
Select Run -> Debug Configurations -> C/C++ Application
Right-click and create a new C/C++ Application
In the Main tab set, set:
Project: Basic_Build
C/C++ Application: out/Host/debug/firmware/app
disable for now the auto build
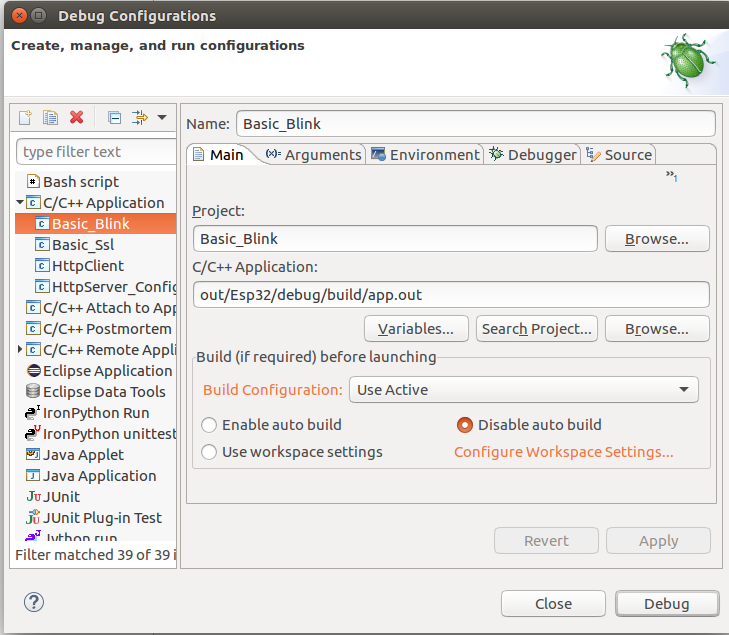
C/C++ Application
Then go to the Debugger tab and point the GDB debugger to your
gdb binary. (Type make list-config and look for GDB.)
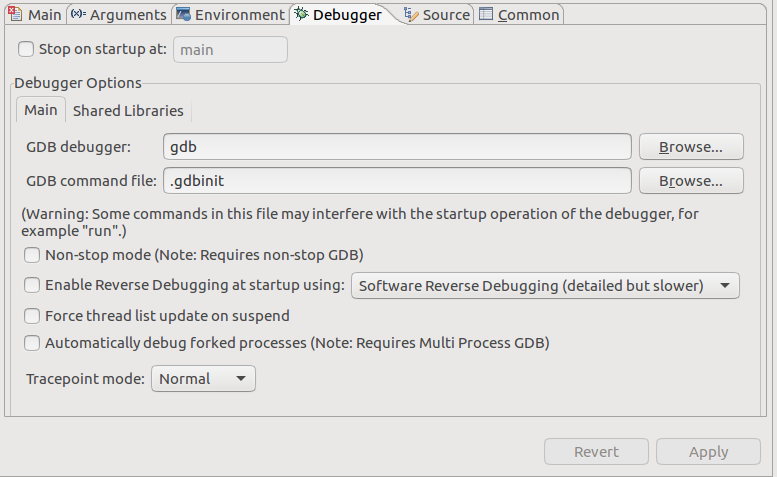
Debugger configuration
We are now ready for debugging. Press the Debug button. (In the screenshot above the Debug button is in the bottom-right corner.) After some seconds your debugging session should be up and running and you can enjoy live debugging.
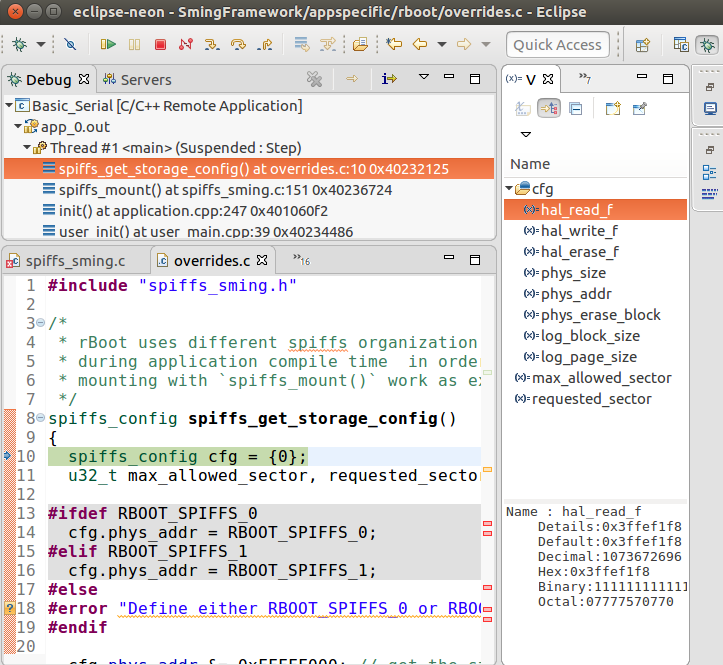
Live Debugging Session
You will be able to see the current variables and their values. You should be able to go step by step, go inside of functions, add add breakpoints and watchpoints.